Portland Guitar Co. | Portland Oregon | Contact Jay Dickinson-503.245.3276 | jay@portlandguitar.com
Home | Orders & Sales | Photo Gallery | Current Builds | Finished Builds
Rosettes & Marquetry |Shop Tour | Biography | News
Engineered Braces | Tilt Action Neck | Split Saddle Bridge | Split Saddle Nut
Portland Guitar Pretty Good Intonation (PGPG) System
Short Version | Introduction | Intonation Errors | Analysis | PG Approach | Comparisons | Conclusion
PGPG Intonation
Analysis
There are a variety of ways to look at the data and extract useful information. Right now we have two objectives in this analysis. First, we would like to have a systematic method to optimize the intonation on an individual guitar, and second we would like to have a simple set of metrics that allows us to objectively compare two guitars or monitor the progress of an individual guitar as it is intonated.
Linear Equation Best Fit to Data: When we apply a linear least square fit (an Excel linear trend line) to a set of data we generate an equation that tells us the slope of the line and its Y-intercept, see Fig 9 for an example. These parameters directly correlate to the adjustments we have at the bridge and nut. The slope of the line is controlled by the position of the bridge saddle. If the slope is positive, the notes are getting sharp as they are played up the fretboard and the bridge saddle is too close to the nut. If the slope is negative the notes start to play flat and the bridge saddle is too far from the nut.
The second parameter we consider from the linear best fit equation is the Y-intercept. We can control this parameter by adjusting the nut saddle position. If the Y-intercept is negative, the intonation is flat and the nut is too close to the bridge. If the Y-intercept is positive the intonation is sharp and the nut is too far from the bridge.
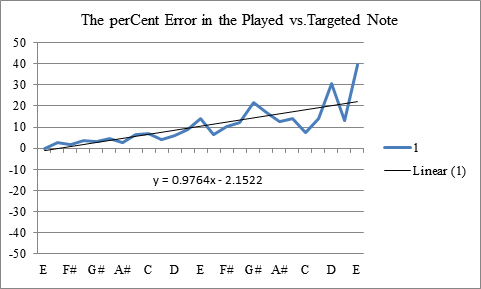
Figure 9
Linear Plots and Body Resonances: When a note is played the top of the guitar vibrates and interacts with the vibrating string. This top resonance interacts with the vibrating string causing the string to play sharp if the top resonance is flat of the string resonance, flat if the resonance is sharp, and causes the note to split in two if the resonance is right on the string frequency. If this is happening and the signal is sufficiently strong, this phenomenon should present itself as a consistently flat set of notes that slowly transition to consistently sharp as they are played up the string. Figure 10 shows a plot where this might be happening around the G#... maybe.
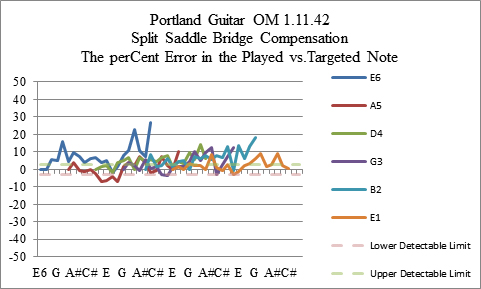
Figure 10
Dot plots to investigate note compatibility: One of the desirable aspects of a pretty well intonated guitar is playing two notes on two strings at the same time and they play in tune. By changing the chart type from a line plot that emphasizes the relationship of notes on a single string to a scatter plot which removes that emphasis, we can easily see the relationship of equal notes on different strings. Figure 11 shows a plot where data points in a vertical line are equivalent notes and the distance between them is a measure of the frequency equivalence. For visual clarity the horizontal axis is the natural log of the frequency.
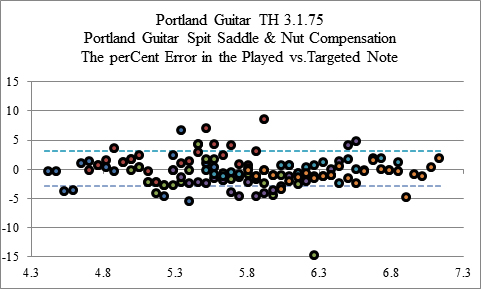
Figure 11
Displaced Dot Plots to Look for Fret Position Errors. Figure 12 is created by offsetting the scatter plots so that notes that are played on a single fret are now shown in a vertical line. By examining the data point placements it should be possible to see systematic fret placement errors. If the note errors drift systematically from sharp to flat or visa-versa it may be caused by a fret placed at an angle. If a single note or set of adjacent notes are sharp or flat, it may be possible that the fret is miss crowned. If all of the notes play sharp or flat it may be possible that the fret is misplaced or the crown is off center.
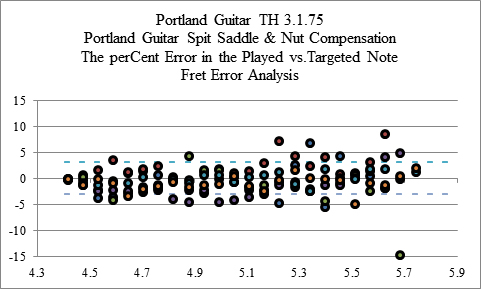
Figure 12
Reduced Plot Playing Area (Practical Playing Area): It may be desirable to optimize the intonation over the set of notes most likely to be played. Figure 13 shows a plot where the highest notes on the lowest strings have been ignored and not plotted. These are notes that are least likely to be played. With a reduced number of notes it will be easier to get the intonation right.
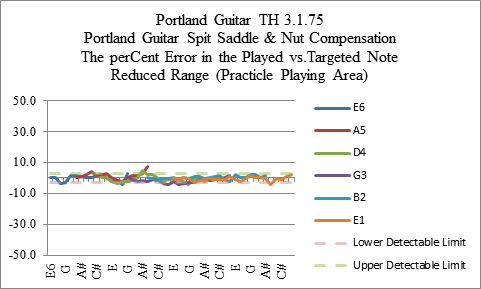
Figure 13
Statistics: The following are a set of statistics that help describe the distribution of errors. We can use these to compare different instruments, or to follow the progress of intonation improvement as we set up a guitar.
Mean: commonly called the average.
Median: the number where half the population is above and half below.
Standard Deviation: a measure of the spread in the data.
Kurtosis: a measure of how much data is in the wings of the distribution.
Intonation Quality Q=Frequency/Delta-Frequency = 100/(RMS Percent Errors)